Be part of JetBrains PHPverse 2026 on June 9 – a free online event bringing PHP devs worldwide together.

daveb2's avatar
Level 3

Clockwork doesn't work in Chrome debug tools (but works in Firefox??)

After upgrading from Laravel 10 -> 11 (maybe it started with 10?) the Clockwork extension for Chrome no longer works, but the FireFox extension still does.

I've tried all of the usual things: uninstalling and re-installing the Chrome extension, upgrading Chrome, uninstalling and reinstalling clockwork in composer, etc.

But in Chrome all I'm getting is:

Chrome debug tools

I suspect this may be related to how Clockwork serves data. I'm hosting a local Laravel site on Apache on a VM running linux (CentOS). There are no network entries that match a search string "clockwork" recorded in the Chrome "Network" tab (using the "filter" option). However, if I do a "Search" for "clockwork" in the Chrome network tab - which I think searches headers - I get some hits in Cookie headers sent even with image assets, eg:

Network tab of Chrome dev tools - searching for the term 'clockwork'

Can anyone suggest where to go from here to get Clockwork working again? I really need to get the profiler tool going, and I can't cope with the FireFox dev tools (though I might have to learn them as Chrome has been problematic lately).

Edit: from @s4muel's post below, here are the details for one of those "waiting..." requests in the Clockwork tab of dev tools:

Chrome dev tools network request details for Clockwork requests

0 likes
5 replies
s4muel's avatar
s4muel
Best Answer
Level 50

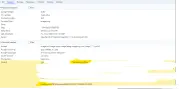
i suppose it is something new in chrome extensions security policies or something. i noticed same behavior recently. i am running my project locally on https, but without valid certificate (self-signed) and the clockwork extension is getting a (failed)net::ERR_CERT_AUTHORITY_INVALID error when trying to communicate.

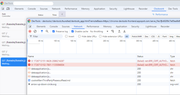
you dont see the requests in network tab, you need to open the devtools for the extension. but it is simple - when you have clockwork in chrome opened (like your first screenshot), just right click anywhere (on one of the requests for example) and choose inspect. another devtool window opens and you can switch to network there. then refresh the original window and you will (hopefully) see all the requests (or failures, as in my case). it bothered me a bit, googled around, trying to find a solution... nothing. i am lazy to redo my docker setup not to use self-signed certificates (but i just should have to 😅) so i switched from chrome extension to the "built-in" web version, just go to your project.test/clockwork and there should be a web version which is as good as the chrome extension version. and it works like a charm.

but since there are at least two of us, ill open an issue in the clockwork repository, someone might resolve it (or navigate us) there

1 like
daveb2's avatar
Level 3

@s4muel Fantastic detective work there... thanks @s4muel ! Yes this is exactly what I'm seeing too, I'm getting ERR_CERT_AUTHORITY_INVALID against the clockwork requests. I too am using self-signed certificates as I'm on development. At least I can see the requests now. Perhaps I will have to debug without https on dev or some other workaround.

I had noticed the web version of clockwork too but the dev tools integration just seems easier to use.

1 like
daveb2's avatar
Level 3

@s4muel thank you for that, let's hope someone sees it and actions it.

shadkamel's avatar

try to access /clockwork in your project if it installed through composer, clock work will create a route for debugging purpose

1 like

Please or to participate in this conversation.